
Fiber optic internet availability maps show which geographic areas in Canada have access to fiber internet service, using official government data aggregated over hexagonal grid zones that represent roughly 25 square kilometers each. The National Broadband Data, maintained by Innovation, Science and Economic Development Canada (ISED) and the CRTC, provides this coverage information through a publicly accessible mapping tool that indicates where 75% or more of dwellings within each zone can access specific download and upload speed tiers. The most recent update occurred in May 2026.
These maps serve as a starting point for determining whether fiber internet might be available at your address, but they come with important limitations. The hexagonal aggregation method means a zone marked as “covered” does not guarantee service to every address within that 25 square kilometer area. Coverage is confirmed only when three-quarters of dwellings in the hexagon meet the speed threshold, leaving potential gaps for individual properties.
Understanding how to interpret these availability maps has become increasingly relevant as fiber infrastructure expands across Canada, a development that has consistently ranked among the top telecom stories in recent years. The maps provide speed markers at 5/1, 10/2, 25/5, and 50/10 Mbps, with a more detailed road-segment layer available for download that breaks coverage down to 250-meter segments rather than large hexagons.
What Fiber Internet Availability Maps Track
Fiber internet availability maps in Canada track broadband service coverage across multiple technology types, with fiber optic infrastructure appearing alongside cable, DSL, fixed wireless, and satellite services in the National Broadband Data. These maps don’t exclusively show fiber, they display where any broadband technology meets specific speed thresholds. The data captures whether service offerings reach 5/1, 10/2, 25/5, or 50/10 Mbps download/upload markers, not the underlying technology delivering those speeds.
The National Broadband Data distinguishes between fiber deployment methods, though this detail matters significantly for performance. Fiber-to-the-home (FTTH) delivers fiber optic cables directly to individual residences, providing the full speed and reliability advantages of the technology. Other deployment models include fiber-to-the-node (FTTN), where fiber runs to a neighbourhood cabinet and traditional copper lines cover the final distance to homes, and fiber-to-the-building (FTTB), common in multi-unit dwellings where fiber reaches the building but not necessarily each unit.
When viewing availability data, consumers should understand that coverage information is aggregated and deployed over a grid of hexagons covering roughly 25 square km each. A hexagon shows coverage when more than 75% of total dwellings within it have access to broadband service meeting the speed markers, based on ISED and the CRTC’s pseudo-household statistical model. This aggregation means a map showing fiber availability in your area doesn’t confirm service at your specific location, it indicates that most dwellings in that geographic zone can access qualifying speeds through at least one provider’s infrastructure.
How Canada’s National Broadband Data Captures Coverage
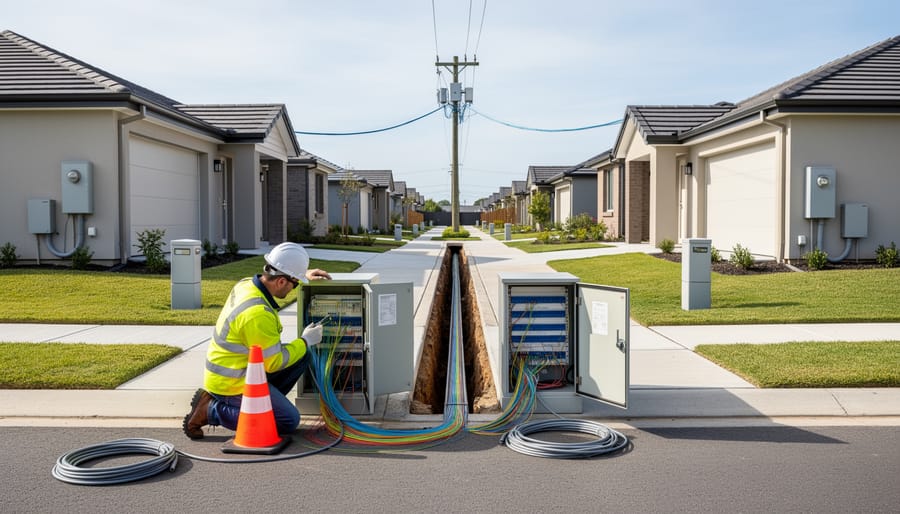
Coverage Granularity and Limitations
The National Broadband Data’s hexagon grid system, while useful for visualizing regional coverage patterns, introduces significant granularity limitations for consumers trying to determine fiber availability at a specific address. Each hexagon covers roughly 25 square km, an area that can encompass diverse neighbourhoods, terrain types, and infrastructure conditions. A hexagon is marked as having coverage only when more than 75% of total dwellings within that zone have access to the specified service tier. This threshold means that up to 25% of homes in a “covered” hexagon may lack fiber access entirely, yet the area appears served on the map.
The 75% dwelling threshold creates accuracy issues at the household level because coverage is aggregated rather than address-specific. If your home falls within the minority lacking service, the map offers no indication of that limitation. The available NBD Roads resource provides finer detail by breaking coverage data down to 250m road segments, which can help identify gaps along specific streets or rural routes. However, even this granular view represents statistical modeling based on pseudo-household data rather than confirmed service at individual addresses.
These limitations explain why availability maps serve as planning tools showing general infrastructure reach rather than definitive guides to service at your location. The aggregation methodology, designed to protect provider confidentiality and simplify data collection, necessarily sacrifices precision for broader coverage insight.
Where to Access Fiber Availability Data
Canadian consumers have two primary sources for official fiber availability data: Innovation, Science and Economic Development Canada’s (ISED) National Broadband Availability Map and the CRTC’s broadband data resources. Both draw from the National Broadband Data, which represents coverage information across Canada for existing broadband service providers and their associated technology types. The most recent update was released in May 2026.
The National Broadband Availability Map serves as the main public tool for checking coverage. To use it effectively:
- Access the map through ISED’s website and navigate to your region of interest
- Zoom in to view the hexagon grid overlay, with each hexagon covering roughly 25 square kilometers
- Click on a hexagon to view available speed tiers (5/1, 10/2, 25/5, or 50/10 Mbps) and technology types
- Note that coverage is reported only when more than 75% of total dwellings in that hexagon have access to service meeting each speed marker
- Cross-reference your specific address location within the hexagon, understanding that aggregated data may not confirm individual home availability
For more granular detail, ISED provides a separate NBD Roads resource showing broadband services per 250-meter road segments available for download. This dataset offers finer resolution than the hexagon view but requires technical skills to interpret.
The datasets have significant limitations. They aggregate service availability using a pseudo-household statistical model, meaning the 75% dwelling threshold can obscure actual service gaps within each hexagon. A hexagon showing fiber coverage doesn’t guarantee every address inside has access, you might live in the 25% without service. The speed tiers tracked (50/10 Mbps maximum) don’t distinguish true fiber-to-the-home from other technologies that meet the same thresholds, making it difficult to identify specifically fiber optic deployments.
Understanding Map Data Versus Actual Service Availability

Coverage shown on availability maps represents an aggregated statistical view, not a guarantee of service at your specific address. When a hexagon on the National Broadband Data map shows fiber coverage, it means 75% or more of dwellings in that roughly 25 square km area can access the specified speed tier, not that every home within that zone can connect.
This threshold creates a practical gap. Your home might sit in a hexagon marked as fiber-covered while the nearest fiber cable terminates three blocks away. The aggregated model tracks regional deployment patterns, not the last-mile infrastructure that actually determines whether a technician can run a line to your door.
Infrastructure availability depends on physical proximity to fiber trunk lines, local distribution networks, and whether a provider has built out service in your immediate neighbourhood. A street-level view matters more than hexagon-level data. Two houses on the same block can face different availability if one sits just beyond a provider’s current service boundary or requires costly infrastructure extensions.
Consumers exploring connectivity options should verify coverage directly with providers using their address, not rely solely on map indicators. Providers can confirm whether their network reaches your location and whether any installation barriers exist. When fiber proves unavailable despite map coverage, alternatives such as cable internet or 5G home internet may offer competitive speeds while infrastructure expands.
What to Do When Fiber Coverage Is Uncertain

When availability maps show fiber coverage in your area but providers say service is unavailable, start by contacting multiple carriers directly with your exact address. Major national providers and regional fiber specialists often have more current infrastructure data than the National Broadband Data’s May 2026 update reflects. Ask specifically about planned deployment timelines, last-mile infrastructure availability, and whether you’re within a serviceable distance from existing fiber lines.
If no provider confirms immediate service, request information about upcoming expansion plans. Some carriers maintain rollout schedules for neighborhoods where infrastructure work is underway. Understanding whether fiber deployment is months away versus years out helps you make informed decisions about interim connectivity options.
When fiber remains unavailable despite map indicators, consider these alternatives. Cable internet often delivers comparable speeds in urban and suburban areas. Fixed wireless and satellite services have expanded significantly, particularly in regions where traditional wireline infrastructure lags. As the telecommunications landscape continues to evolve, including phone bill changes affecting service competition, more options may emerge for consumers facing limited fiber access.
Document your findings and report persistent coverage inaccuracies to ISED through their feedback channels. Your input helps improve future mapping accuracy and may flag areas needing infrastructure attention.
Frequently Asked Questions
How often is Canada’s fiber availability map data updated?
The National Broadband Data resource was most recently updated in May 2026. Update frequency depends on data collection cycles from service providers and the time required to process and verify coverage information.
Why does the map show fiber coverage in my area but providers say it’s not available at my address?
The coverage data represents areas where 75% or more dwellings have access to specific speed tiers within roughly 25 square km hexagons. Your individual address may fall within the uncovered 25% of that area, or you may need last-mile infrastructure that hasn’t been built yet.
What download speed qualifies as fiber on availability maps?
The maps track speed markers of 5/1, 10/2, 25/5, and 50/10 Mbps, but these thresholds don’t distinguish fiber from other technologies. True fiber optic service typically delivers 100 Mbps or higher, though the technology itself can support gigabit speeds.
Can I access more detailed coverage information than the hexagon grid shows?
Yes. The NBD Roads resource provides broadband service information at a more granular level, representing coverage per 250m road segments rather than the broader hexagon areas.
How do I report incorrect coverage information on the availability map?
Contact Innovation, Science and Economic Development Canada (ISED) directly through their official channels to report discrepancies. Provider-specific coverage concerns should also be raised with the individual service provider, whether you’re comparing TELUS vs Bell or other carriers.
These questions reflect the most common confusion consumers face when trying to interpret availability maps. The distinction between aggregated coverage data and actual service at a specific address causes the most frustration, particularly when the 75% dwelling threshold means a quarter of homes in a covered area still lack access. Understanding that speed markers don’t identify the underlying technology helps consumers recognize when they need to verify whether fiber specifically serves their location, not just whether broadband meeting certain speeds exists somewhere in their general area.
Fiber internet availability maps serve as valuable starting points for Canadian consumers exploring connectivity options, but they cannot replace direct verification with service providers. The National Broadband Data’s hexagon-based methodology, with its 25 square km coverage areas and 75% dwelling threshold, means that map data shows regional trends rather than address-specific service availability. A hexagon marked as having fiber coverage does not guarantee that every home within that area can access the service, particularly in areas with uneven infrastructure deployment. These mapping tools continue to improve as ISED updates data and providers expand their networks, yet the gap between aggregated coverage statistics and individual household access remains significant. Before making connectivity decisions, consumers should contact providers directly to confirm service availability at their specific address, inquire about installation timelines, and understand the technology being offered. As Canada’s broadband infrastructure evolves and data collection methods become more granular, these maps will provide increasingly useful guidance, but they remain best understood as planning tools rather than definitive service directories.